MULTI-UTILITY
39. Consumer Complaints and Inquiries — Electric Industry for CY 2013 – CY 2017
CES — Competitive Energy Suppliers
Pepco + CES — A consumer complaint that involves Pepco and CES (not shown on the graph since this report was discontinued in 2015)
OCS Consumer Complaints and Inquiries
Total Complaints and Inquiries for the electric industry increased 14.5% from 489 in 2016, to 560 in 2017. Total Complaints and Inquiries for Pepco increased 10.2% from 361 in 2016 to 398 in 2017. Total Complaints and Inquiries for Competitive Energy Suppliers (CES) increased 26.6% from 128 in 2016 to 162 in 2017.
Source: Consumer Complaint Management System (CCMS), Office of Consumer Services of the Commission.
40. Consumer Complaints and Inquiries — Natural Gas for CY 2013 – CY 2017
CGS — Competitive Gas Suppliers
WGL + CGS — A consumer complaint that involves WGL and CGS (not shown on the graph since this report was discontinued in 2014)
OCS Consumer Complaints and Inquiries
Total Complaints and Inquiries for the gas industry increased 48.3% from 201 in 2016 to 298 in 2017. Total Complaints and Inquiries for Washington Gas increased 48.7% from 193 in 2016 to 287 in 2017. Total Complaints and Inquiries for Competitive Gas Suppliers (CGS) increased 37.5% from 8 in 2016 to 11 in 2017.
Source: Consumer Complaint Management System (CCMS), Office of Consumer Services of the Commission.
41. Consumer Complaints and Inquiries — Telecom for CY 2013 - CY 2017
CLEC — Certificated Local Exchange Carrier
A consumer complaint that involves Verizon and a CLEC (not shown on the graph since this report was discontinued in 2014)
OCS Consumer Complaints and Inquiries
Total Complaints and Inquiries for the telecom industry increased 19.7% from 193 in 2016 to 231 in 2017. Total Complaints and Inquires for Verizon increased 31.0% from 155 in 2016 to 203 in 2017. Total Complaints and Inquiries for Competitive Local Exchange Carriers (CLECs) decreased 26.3% from 38 in 2016 to 28 in 2017.
Source: Consumer Complaint Management System (CCMS), Office of Consumer Services of the Commission.
42. Number and Percentage of Rate Cases Processed on a Timely Basis
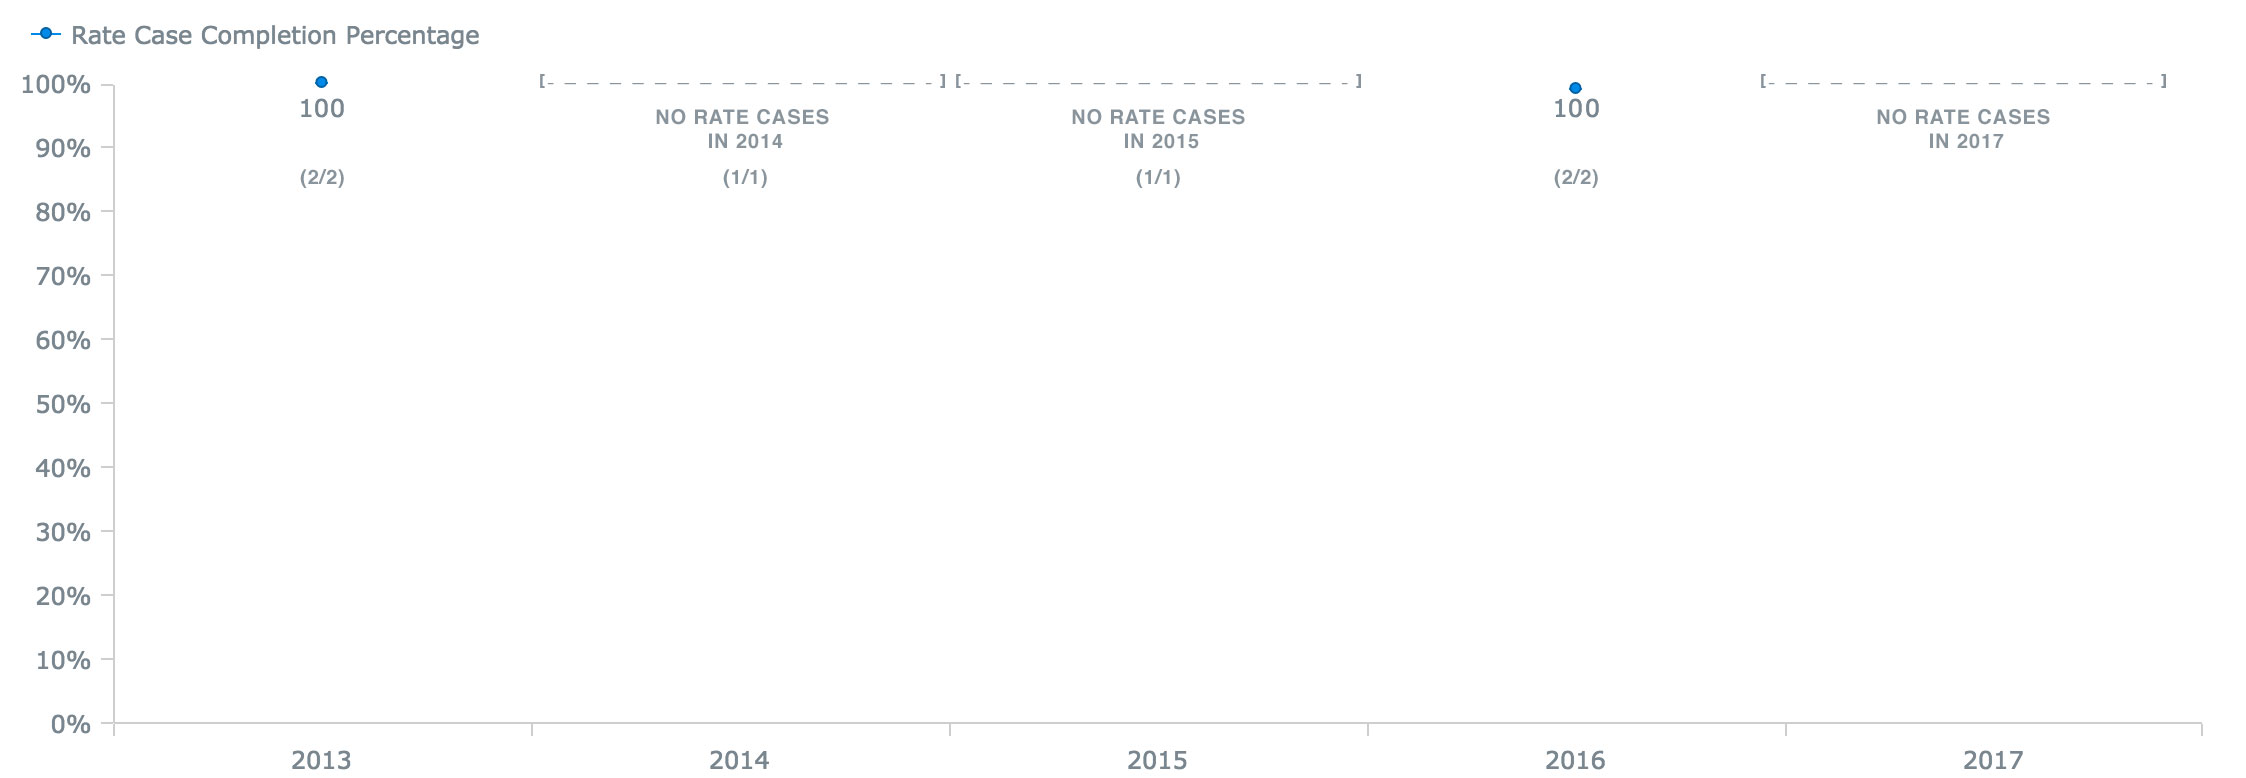
* (#/#) Number of Rate Cases Processed on a Timely Basis
Target: Issue decisional orders within 90 days of the close of the record.
Performance: There were no rate cases in 2017.
Source: : Office of General Counsel, DCPSC
43. Total Number of Formal Cases Closed and Opened in CY 2013 – CY 2017
In CY 2017, the PSC opened eight formal cases and closed four formal cases.
Source: Commission Secretary's Office of the DCPSC
44. Total Number of Electric, Natural Gas & Telephone Tariffs Processed* in CY 2013 – CY 2017
* Tariffs processed means tariffs reviewed, approved, withdrawn, or denied. Telecom promotions are not included in the tariff count.
The PSC fully regulates electric and natural gas tariffs. Such tariffs require a formal filing and result in the Commission Order to Approve or to Deny or a Notice of Final Tariff (if the tariff is approved). For telecom, PSC reviews the incumbent telephone service provider tariffs. CLECs' tariffs deemed approved upon filing, therefore they are not reviewed, approved, or denied by the Commission in the normal course of tariff process.
On October 1, 2008, Price Cap Plan ("Plan") 2008 became effective per Order No. 15071, issued September 28, 2008. In accordance with the Plan, Verizon is allowed to make changes to its discretionary and competitive services, without formal approval of the PSC, by filing a description of the changes and relevant cost support information on five-days notice. The PSC does not set rates for competitive services.
Rate increases for discretionary services are capped at no more than 15%.
45. Number of Electric and Natural Gas Meter Tests Witnessed in CY 2013 – CY 2017
Meter tests are referred by the Commission pursuant to a request by a consumer. There were 16 natural gas meter tests and 105 electric meter tests that were refereed in CY 2017.
Source: DCPSC
46. Number of Outreach Activities (Excluding Meter Tests) in CY 2013 – CY 2017
In 2017, the Commission continued its ongoing efforts to engage and educate the community about public utility services and benefits — engaging intensively and directly with consumers, community leaders, District Council Constituent Services staff, and as well with the non-residential and non-profit sectors. As the District’s population continues to grow to over 700,000 residents, it is important to find new and interesting ways to engage directly with each segment (and interest) of this ever-diversifying population. The Commission is working directly with communities to educate District residents as to the array of available utility services and programs. The Commission is augmenting these efforts through our sponsorship and participation in community forums, civic association meetings, community walks and office hours, and by speaking directly to various special interest populations, such as seniors.
Source: Office of Consumer Services of the DCPSC
47. Diverse Suppliers and Certified Business Enterprises (CBE) CY 2013 - CY 2017 Performance
| System-Wide Diverse Suppliers compared to Total CBE System Procurement | |||||
| Utility | 2013 | 2014 | 2015 | 2016 | 2017 |
|---|---|---|---|---|---|
| Diverse Supplier Percentage of Total System Spend | Diverse Supplier Percentage of Total System Spend | Diverse Supplier Percentage of Total System Spend | Diverse Supplier Percentage of Total System Spend | Diverse Supplier Percentage of Total System Spend | |
| Pepco | 13.29% | 13.24% | 13.30% | 16.70% | 25.70% |
| WGL | 20.28% | 22.86% | 26.60% | 29.10% | 24.00% |
| Verizon | 12.63% | 44.13% | 39.00% | 48.20% | 41.90% |
| DC-based Certified Business Enterprises (CBE) compared to Total System Procurement | |||||
| Utility | 2013 | 2014 | 2015 | 2016 | 2017 |
|---|---|---|---|---|---|
| CBE Percentage of Total System Spend | CBE Percentage of Total System Spend | CBE Percentage of Total System Spend | CBE Percentage of Total System Spend | CBE Percentage of Total System Spend | |
| Pepco | 3.14% | 5.51% | 5.51% | 7.20% | 13.40% |
| WGL | 5.79% | 7.48% | 7.48% | 7.70% | 7.10% |
| Verizon | 14.08% | 18.52% | 18.52% | 18.40% | 19.80% |
| DC-based Certified Business Enterprises (CBE) compared to DC Procurement | |||||
| Utility | 2013 | 2014 | 2015 | 2016 | 2017 |
|---|---|---|---|---|---|
| CBE Percentage of Total DC Procurement Spend | CBE Percentage of Total DC Procurement Spend | CBE Percentage of Total DC Procurement Spend | CBE Percentage of Total DC Procurement Spend | CBE Percentage of Total DC Procurement Spend | |
| Pepco | 32.80% | 41.63% | 97.20% | 61.40% | 39.20% |
| WGL | 38.86% | 50.57% | 57.10% | 53.40% | 50.30% |
| Verizon | N/A | N/A | N/A | N/A | N/A |
In 2018, Pepco, WGL and Verizon filed their CY 2017 Supplier Diversity Annual Reports in accordance with the February 12, 2012 Memoranda of Understanding (MOU) between the companies and the PSC regarding contracting with diverse suppliers and Certified Business Enterprises (CBEs). A diverse supplier is a minority business enterprise, a women business enterprise, a service disabled veteran business enterprise or a non-profit. CBEs are defined as businesses certified by the D.C. Department of Small and Local Business Development.
Pepco reported higher percentages of Supplier Diversity and CBE participation in 2017 compared to 2016. WGL reported lower percentage for Supplier Diversity and CBE participation in 2017 compared to 2016.
Verizon does not file DC-specific procurement dollars spent. Therefore, the CBE percentage cannot be calculated.
Source: 2015, 2014, 2013 Supplier Diversity Reports from Pepco, WGL and Verizon